Sysstat
For disk I/O trending there are a few options. the sar command from sysstat. By default, it gives output like this:
# sar
Linux 2.6.32-642.11.1.el6.x86_64 (test.geekdecoder.com)    01/26/2017      _x86_64_        (2 CPU)

12:00:01 AM     CPU     %user     %nice   %system   %iowait    %steal     %idle
12:10:01 AM     all      0.03      0.00      0.03      0.09      0.00     99.85
12:20:01 AM     all      0.27      0.00      0.04      0.00      0.00     99.69
12:30:01 AM     all      0.33      0.00      0.05      0.00      0.00     99.62
12:40:01 AM     all      1.01      0.00      0.18      1.18      0.00     97.63
12:50:01 AM     all      0.15      0.00      0.04      0.00      0.00     99.80
01:00:01 AM     all      0.16      0.00      0.03      0.00      0.00     99.80
01:10:01 AM     all      0.22      0.00      0.04      0.00      0.00     99.74
01:20:01 AM     all      0.36      0.00      0.05      0.00      0.00     99.59
01:30:01 AM     all      0.23      0.00      0.04      0.00      0.00     99.74
01:40:01 AM     all      0.70      0.00      0.25      6.23      0.00     92.82
01:50:01 AM     all      0.13      0.00      0.03      0.00      0.00     99.83
02:00:01 AM     all      0.16      0.00      0.04      0.00      0.00     99.80
02:10:01 AM     all      0.21      0.00      0.04      0.00      0.00     99.75
02:20:01 AM     all      0.30      0.00      0.04      0.00      0.00     99.66
02:30:01 AM     all      0.14      0.00      0.03      0.00      0.00     99.83
02:40:01 AM     all      0.20      0.00      0.03      0.00      0.00     99.76
02:50:01 AM     all      0.32      0.00      0.05      0.00      0.00     99.63
03:00:01 AM     all      0.21      0.00      0.03      0.00      0.00     99.76
03:10:01 AM     all      0.19      0.00      0.04      0.00      0.00     99.77
03:20:01 AM     all      0.12      8.44      2.69     10.79      0.00     77.96
03:30:01 AM     all      0.13      4.52      8.36      0.30      0.00     86.69
03:40:01 AM     all      0.48      0.00      0.05      0.02      0.00     99.45
03:50:01 AM     all      0.15      0.00      0.04      0.01      0.00     99.80
04:00:01 AM     all      0.13      0.00      0.03      0.00      0.00     99.84
04:10:01 AM     all      0.48      0.00      0.06      0.04      0.00     99.43
04:20:01 AM     all      0.17      0.00      0.05      0.11      0.00     99.67
04:30:01 AM     all      0.22      0.00      0.04      0.00      0.00     99.74
04:40:01 AM     all      0.89      0.00      0.08      0.16      0.00     98.87
04:50:01 AM     all      0.55      0.00      0.07      0.05      0.00     99.34
05:00:01 AM     all      0.11      0.00      0.04      0.01      0.00     99.85
05:10:01 AM     all      0.09      0.00      0.03      0.00      0.00     99.87
05:20:01 AM     all      0.17      0.00      0.04      0.00      0.00     99.80
05:30:01 AM     all      0.27      0.00      0.05      0.08      0.00     99.60
iotop
# iotop
Total DISK READ: 0.00 B/s | Total DISK WRITE: 0.00 B/s
  TID  PRIO  USER     DISK READ  DISK WRITE  SWAPIN     IO>    COMMAND
    1 be/4 root        0.00 B/s    0.00 B/s  0.00 %  0.00 % init
    2 be/4 root        0.00 B/s    0.00 B/s  0.00 %  0.00 % [kthreadd]
    3 rt/4 root        0.00 B/s    0.00 B/s  0.00 %  0.00 % [migration/0]
    4 be/4 root        0.00 B/s    0.00 B/s  0.00 %  0.00 % [ksoftirqd/0]
    5 rt/4 root        0.00 B/s    0.00 B/s  0.00 %  0.00 % [stopper/0]
    6 rt/4 root        0.00 B/s    0.00 B/s  0.00 %  0.00 % [watchdog/0]
    7 rt/4 root        0.00 B/s    0.00 B/s  0.00 %  0.00 % [migration/1]
    8 rt/4 root        0.00 B/s    0.00 B/s  0.00 %  0.00 % [stopper/1]
    9 be/4 root        0.00 B/s    0.00 B/s  0.00 %  0.00 % [ksoftirqd/1]
   10 rt/4 root        0.00 B/s    0.00 B/s  0.00 %  0.00 % [watchdog/1]
   11 be/4 root        0.00 B/s    0.00 B/s  0.00 %  0.00 % [events/0]
   12 be/4 root        0.00 B/s    0.00 B/s  0.00 %  0.00 % [events/1]
   13 be/4 root        0.00 B/s    0.00 B/s  0.00 %  0.00 % [events/0]
   14 be/4 root        0.00 B/s    0.00 B/s  0.00 %  0.00 % [events/1]
   15 be/4 root        0.00 B/s    0.00 B/s  0.00 %  0.00 % [events_long/0]
   16 be/4 root        0.00 B/s    0.00 B/s  0.00 %  0.00 % [events_long/1]
   17 be/4 root        0.00 B/s    0.00 B/s  0.00 %  0.00 % [events_power_ef]
   18 be/4 root        0.00 B/s    0.00 B/s  0.00 %  0.00 % [events_power_ef]
   19 be/4 root        0.00 B/s    0.00 B/s  0.00 %  0.00 % [cgroup]
Use the iotop command with o option to print actual I/O activity.
# iotop -o
qTotal DISK READ: 0.00 B/s | Total DISK WRITE: 0.00 B/s
  TID  PRIO  USER     DISK READ  DISK WRITE  SWAPIN     IO>    COMMAND
Another option is to use is “sudo iotop -aoP”
-a Will show accumulated output
-o Will only output
-P Will only show processes instead of threads
This program will tell you how much a process has written to disk and read from disk since iotop was started.
sudo iotop -aoP

Total DISK READ: 0.00 B/s | Total DISK WRITE: 0.00 B/s
  PID  PRIO  USER     DISK READ  DISK WRITE  SWAPIN     IO>    COMMAND
  420 be/3 root          0.00 B     28.00 K  0.00 %  0.00 % [jbd2/dm-0-8]
 2151 be/4 apache        0.00 B      4.00 K  0.00 %  0.00 % httpd
 2155 be/4 apache        0.00 B      4.00 K  0.00 %  0.00 % httpd
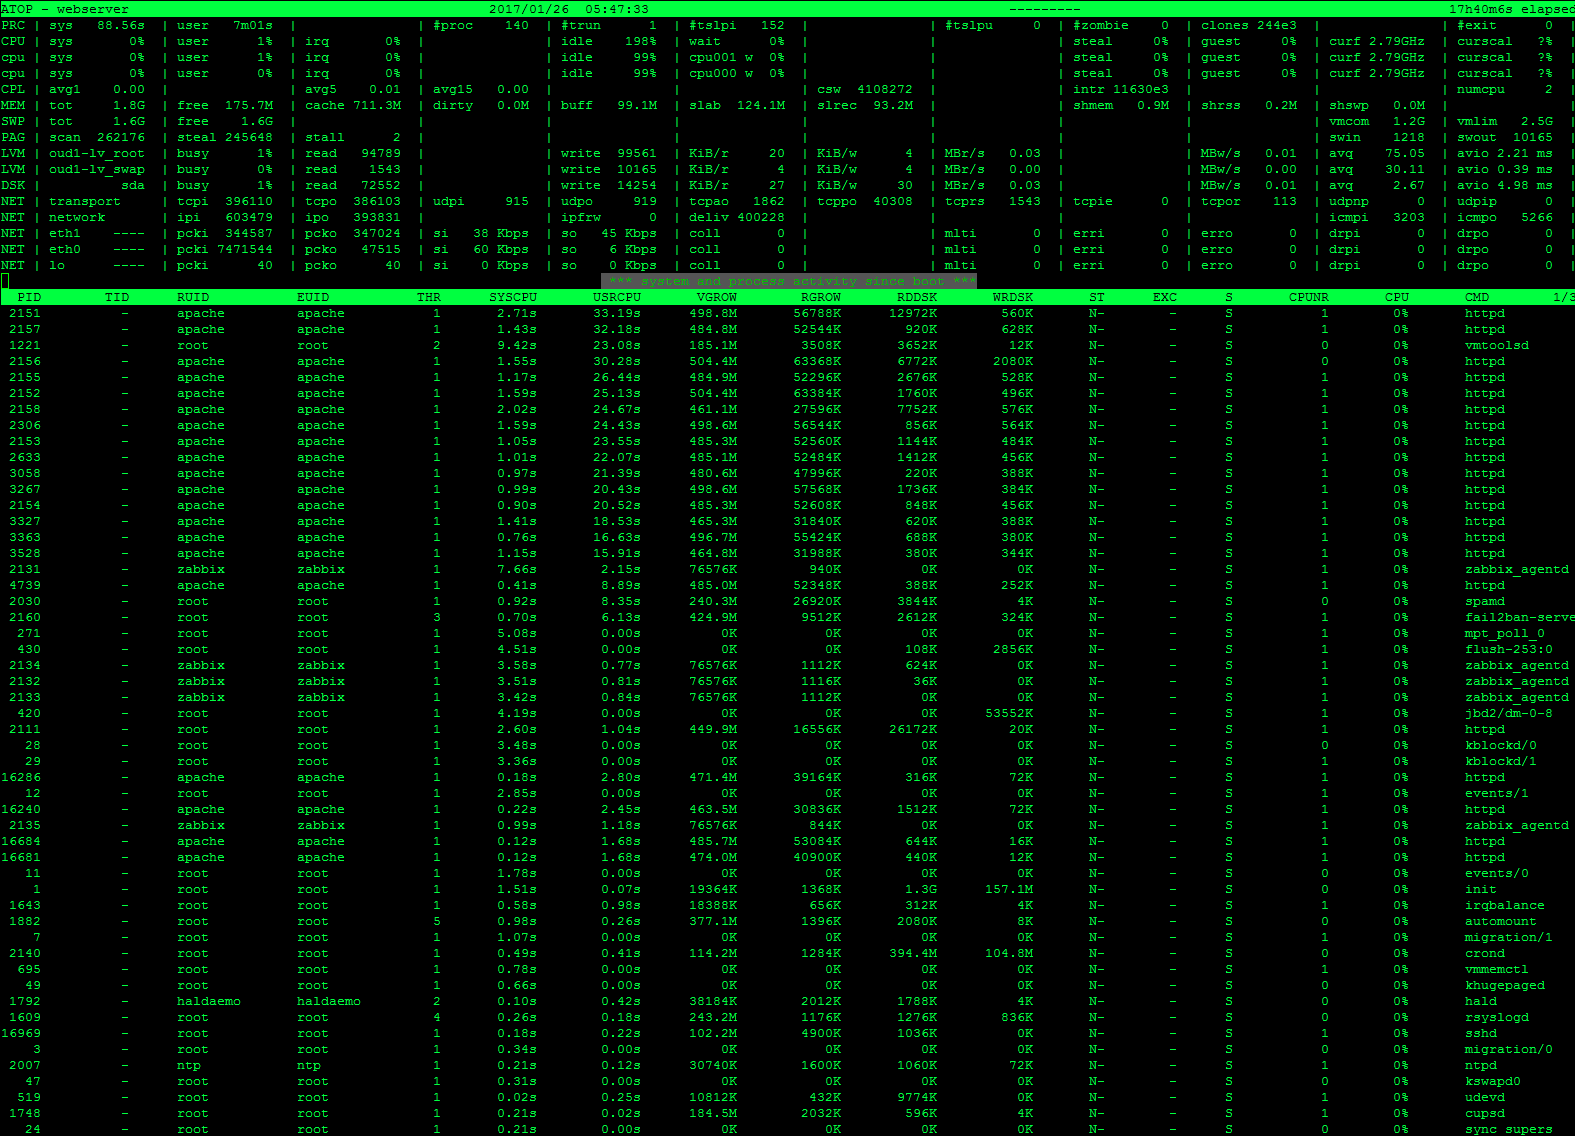
atop
A great overview over all resources (CPU, memory/swap, network and disk I/O) or you can drill down to a single resource and sort processes by how much they consume.
IOSTAT
To print individual hard disk I/O activity, use the iostat command with below option. It will print the output 5 second interval
# iostat -dx 5
Linux 2.6.32-642.11.1.el6.x86_64 (webserver.geekdecoder.com)    01/26/2017      _x86_64_        (2 CPU)

Device:         rrqm/s   wrqm/s     r/s     w/s   rsec/s   wsec/s avgrq-sz avgqu-sz   await r_await w_await  svctm  %util
sda               0.39     1.50    1.14    0.22    62.75    13.83    56.01     0.02   13.32    8.92   35.78   4.98   0.68
dm-0              0.00     0.00    1.49    1.57    62.13    12.54    24.39     0.51  164.39   19.85  302.07   2.21   0.68
dm-1              0.00     0.00    0.02    0.16     0.19     1.28     8.00     0.00   11.81   13.22   11.60   0.39   0.01

Device:         rrqm/s   wrqm/s     r/s     w/s   rsec/s   wsec/s avgrq-sz avgqu-sz   await r_await w_await  svctm  %util
sda               0.00     0.00    0.20    0.00     3.20     0.00    16.00     0.01   42.00   42.00    0.00  42.00   0.84
dm-0              0.00     0.00    0.00    0.00     0.00     0.00     0.00     0.00    0.00    0.00    0.00   0.00   0.00
dm-1              0.00     0.00    0.00    0.00     0.00     0.00     0.00     0.00    0.00    0.00    0.00   0.00   0.00

Device:         rrqm/s   wrqm/s     r/s     w/s   rsec/s   wsec/s avgrq-sz avgqu-sz   await r_await w_await  svctm  %util
sda               0.00     0.40    0.00    0.40     0.00     6.40    16.00     0.00    0.00    0.00    0.00   0.00   0.00
dm-0              0.00     0.00    0.00    0.80     0.00     6.40     8.00     0.00    0.00    0.00    0.00   0.00   0.00
dm-1              0.00     0.00    0.00    0.00     0.00     0.00     0.00     0.00    0.00    0.00    0.00   0.00   0.00
dstat
Or, dstat can show totals and statistics per disk and even md-devices (RAID), also can use colors for better overview:
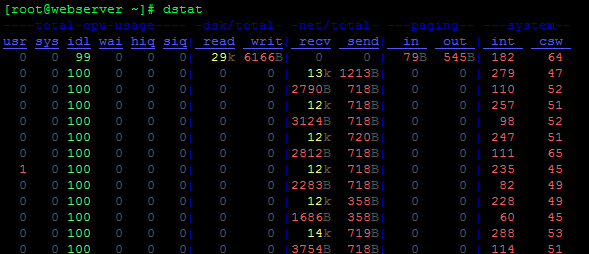
# dstat

----total-cpu-usage---- -dsk/total- -net/total- ---paging-- ---system--
usr sys idl wai hiq siq| read  writ| recv  send|  in   out | int   csw
  0   0  99   0   0   0|  29k 6166B|   0     0 |  79B  545B| 182    64
  0   0 100   0   0   0|   0     0 |  13k 1213B|   0     0 | 279    47
  0   0 100   0   0   0|   0     0 |2790B  718B|   0     0 | 110    52
  0   0 100   0   0   0|   0     0 |  12k  718B|   0     0 | 257    51
  0   0 100   0   0   0|   0     0 |3124B  718B|   0     0 |  98    52
  0   0 100   0   0   0|   0     0 |  12k  720B|   0     0 | 247    51
  0   0 100   0   0   0|   0     0 |2812B  718B|   0     0 | 111    65
  1   0 100   0   0   0|   0     0 |  12k  718B|   0     0 | 235    45
  0   0 100   0   0   0|   0     0 |2283B  718B|   0     0 |  82    49
  0   0 100   0   0   0|   0     0 |  12k  358B|   0     0 | 228    49
  0   0 100   0   0   0|   0     0 |1686B  358B|   0     0 |  60    45
  0   0 100   0   0   0|   0     0 |  14k  719B|   0     0 | 288    53
  0   0 100   0   0   0|   0     0 |3754B  718B|   0     0 | 114    51
  0   0 100   0   0   0|   0     0 |  12k  456B|   0     0 | 224    41
  0   0 100   0   0   0|   0     0 |2535B  456B|   0     0 |  71    47
  0   0 100   0   0   0|   0     0 |  13k  456B|   0     0 | 233    43
  0   0 100   0   0   0|   0     0 |2368B  358B|   0     0 |  64    43