The top program is a command-line tool that shows system resource utilization, processes running, and their related information. It can be used in a terminal or command prompt.
Let’s dig in to see more option on how the top program can help.
Here are the basic steps to use the top program:
Open a terminal or command prompt.
Type “top” and press Enter.
The top program will display a list of processes, ordered by their CPU usage.
The default display contains two areas of information: the summary area (or dashboard), and the task area (or process list). By default, top updates its display every three seconds—you’ll notice a slight flicker when it does.
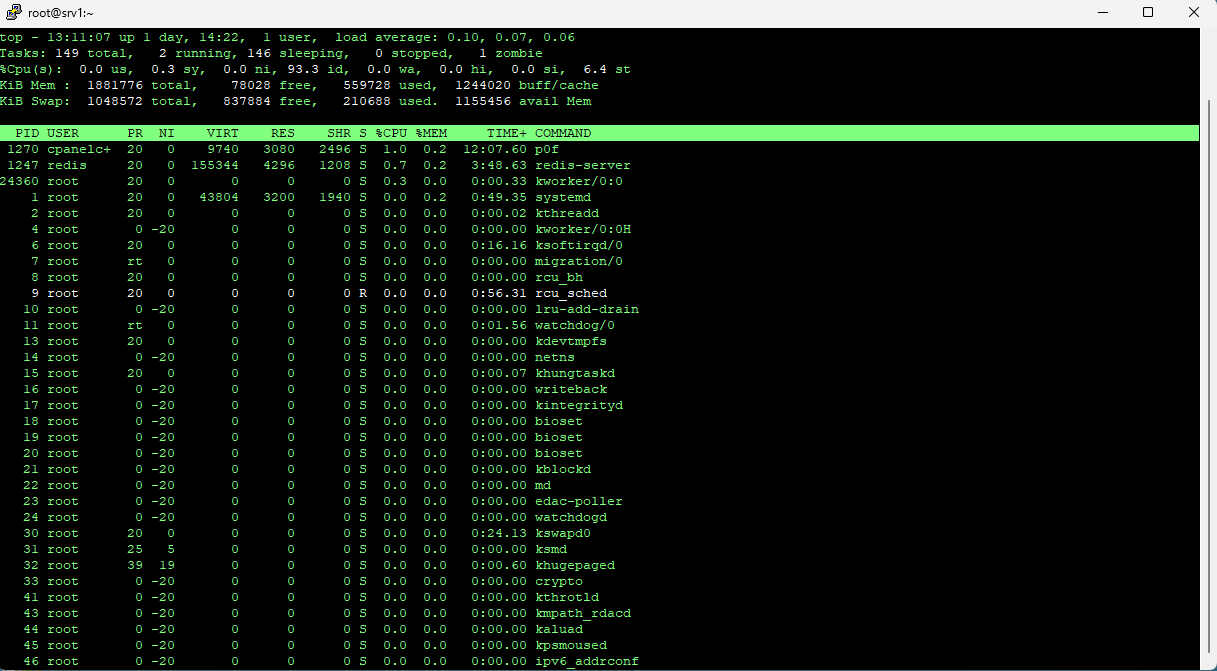
The third line displays the following central processing unit (CPU) values:
us: Amount of time the CPU spends executing processes for people in “user space.”
sy: Amount of time spent running system “kernel space” processes.
ni: Amount of time spent executing processes with a manually set nice value.
id: Amount of CPU idle time.
wa: Amount of time the CPU spends waiting for I/O to complete.
hi: Amount of time spent servicing hardware interrupts.
si: Amount of time spent servicing software interrupts.
st: Amount of time lost due to running virtual machines (“steal time”).
The fourth line shows the total amount (in kibibytes) of physical memory, and how much is free, used, and buffered or cached.
The fifth line shows the total amount (also in kibibytes) of swap memory, and how much is free, used, and available. The latter includes memory that’s expected to be recoverable from caches.
The column headings in the process list are as follows:
PID: Process ID.
USER: The owner of the process.
PR: Process priority.
NI: The nice value of the process.
VIRT: Amount of virtual memory used by the process.
RES: Amount of resident memory used by the process.
SHR: Amount of shared memory used by the process.
S: Status of the process. (See the list below for the values this field can take).
%CPU: The share of CPU time used by the process since the last update.
%MEM: The share of physical memory used.
TIME+: Total CPU time used by the task in hundredths of a second.
COMMAND: The command name or command line (name + options).
Memory values are shown in kibibytes. The COMMAND column is off-screen, to the right—it didn’t fit in the image above, but we’ll see it shortly.
The status of the process can be one of the following:
D: Uninterruptible sleep
R: Running
S: Sleeping
T: Traced (stopped)
Z: Zombie
Press Q to exit top.
Scrolling the Display
You can press the Up or Down Arrows, Home, End, and Page Up or Down keys to move up and down and access all the processes.
Press the Left or Right Arrow to move the process list sideways. This is useful to see any columns that don’t fit within the confines of the terminal window.
To sort the processes by other criteria, such as memory usage or process ID, press the corresponding key on your keyboard (M for memory, P for PID, etc.).
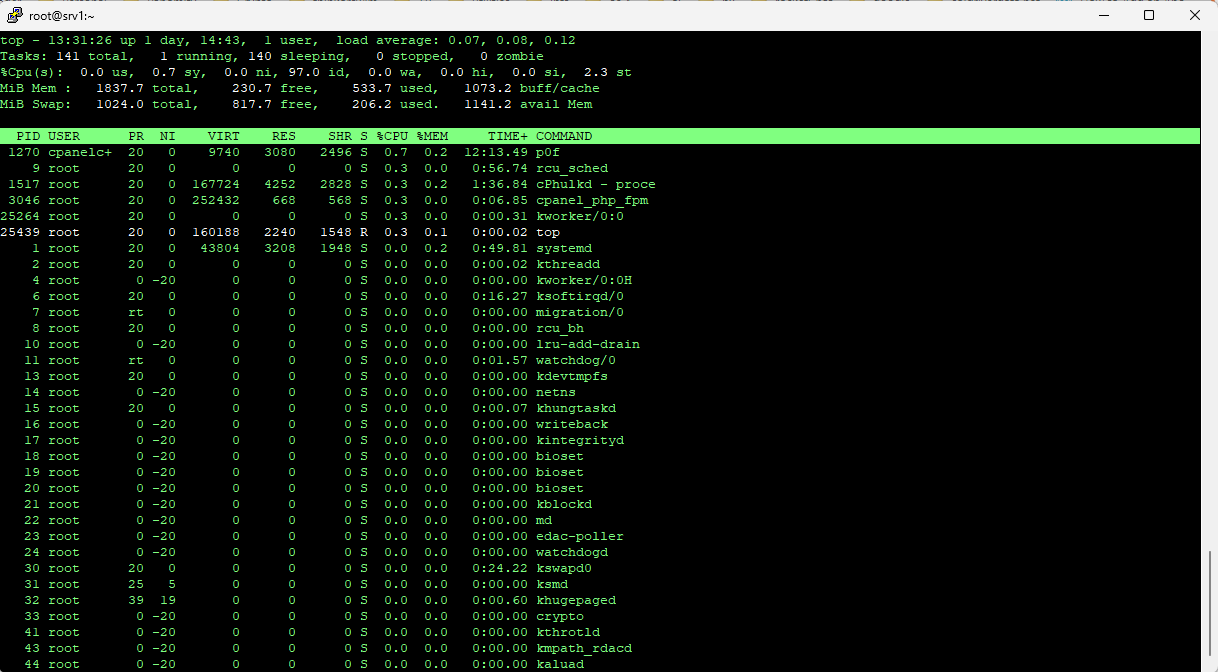
Here is top with the “M” Key for Memory
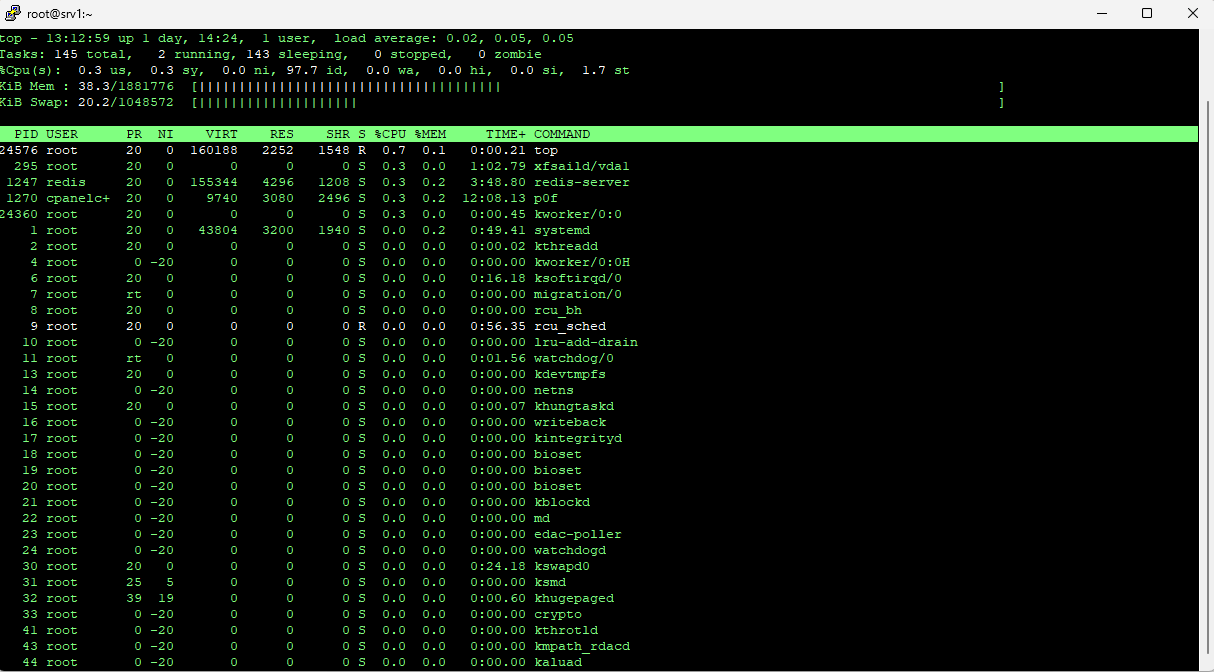
Press capital E to cycle through the units used to display memory values in these options: kibibytes, mebibytes, gibibytes, tebibytes, pebibytes, and exbibytes. The unit in use is the first item on lines four and five.
Press lowercase “e” to do the same thing for the values in the process list: kibibytes, mebibytes, gibibytes, tebibytes, and pebibytes.
Color and Highlighting
You can press “z” to add color to the display.
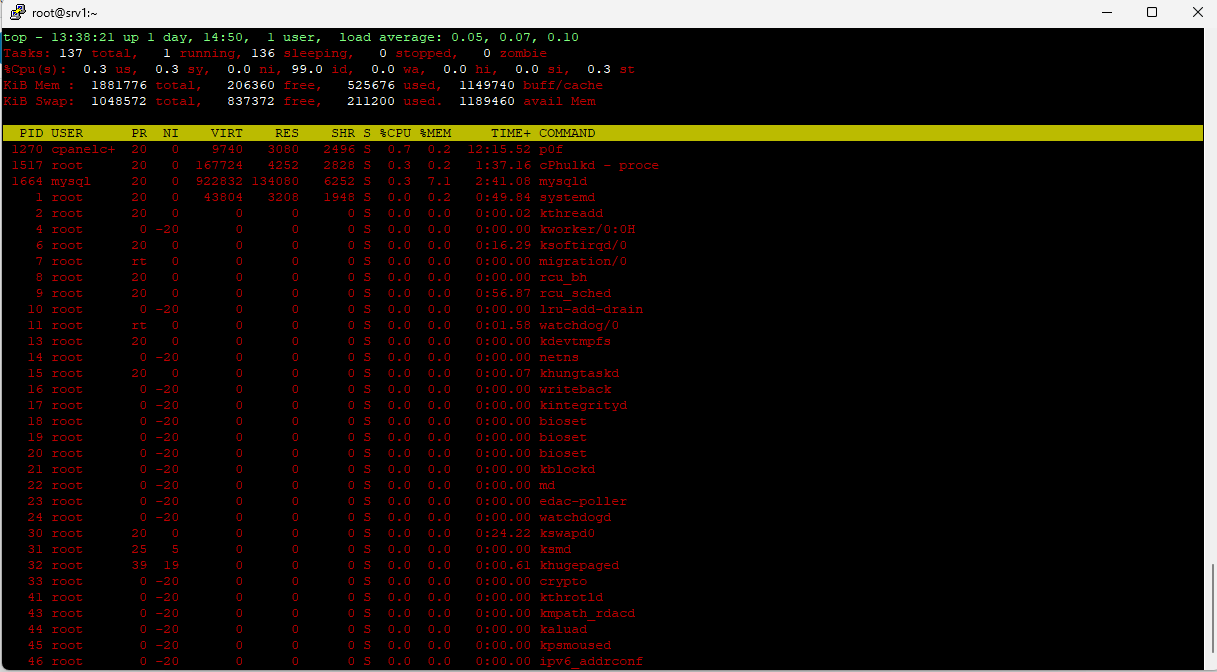
Press “y” to highlight running tasks in the process list. Pressing “x” highlights the column used to sort the process list. You can toggle between bold and reversed text highlighting by pressing “b.”
Sorting by Columns
By default, the process list is sorted by the %CPU column. You can change the sort column by pressing the following:
P: The %CPU column.
M: The %MEM column.
N: The PID column.
T: The TIME+ column.
Renice a Process
You can press “r” to change the nice value (priority) for a process. You’ll be prompted for the process ID. Just press Enter to use the process ID of the task at the top of the process window. We type 7800, which happens to be the process ID of an instance of Firefox.
Kill a Process
Press “k” to kill a process. You’ll then be prompted for the process ID you want to kill. In fact, you can send any signal to the process. We’re going to kill process 7879, which has stopped responding.
Quit
To quit the top program, press the “q” key.
You can also use the top program with command-line options to customize its output, such as changing the update interval or sorting criteria. You can refer to the top program’s manual page (“man top”) for more information.